Multiple Choice
A manufacturer records the number of errors each work station makes during the week. The data are as follows.
Which of these choices display the correct dotplot?
A) Number of Errors for the Week for Workstations 
B) Number of Errors for the Week for Workstations 
C) Number of Errors for the Week for Workstations 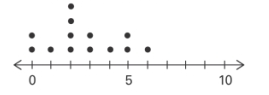
D) Number of Errors for the Week for Workstations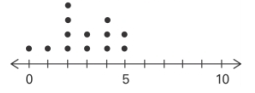
Correct Answer:

Verified
Correct Answer:
Verified
Q13: Graphs should be constructed in a way
Q31: The linear _ coefficient denoted by r
Q32: Which choice displays the best graphic
Q35: A nurse measured the blood pressure of
Q36: The frequency distribution below summarizes employee
Q38: The following data show the number
Q39: The graph below shows the number of
Q41: The weights (in pounds)of 22 members
Q42: The scatterplot below displays the amount of
Q57: Describe how a data point labeled as