Multiple Choice
The time series graph below shows annual sales figures (in thousands of dollars)
For a well known department store chain. Which model would be most appropriate for
Forecasting this series? 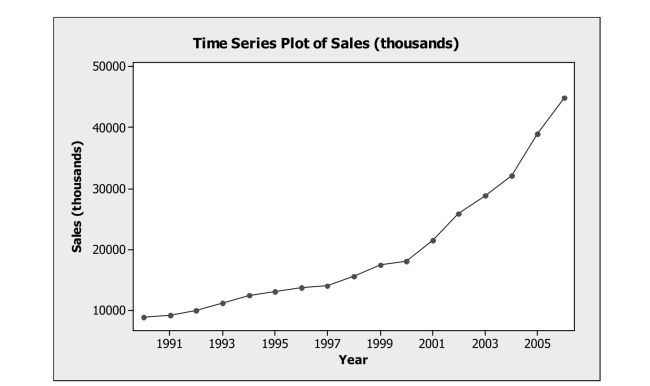
A) Moving Average
B) Single Exponential Smoothing
C) Quadratic Trend
D) Linear Trend
E) Seasonal Regression
Correct Answer:

Verified
Correct Answer:
Verified
Related Questions
Q2: Data were collected for a sample
Q3: Weekly commodity prices for heating oil
Q4: Quarterly returns were forecasted for a mutual
Q5: The residual plot for a linear regression
Q6: In order to examine if there
Q7: Based on returns for the last
Q8: A least squares estimated regression line has
Q9: The time series graph below shows monthly
Q10: Stock prices and earnings per share
Q11: For many countries tourism is an