Multiple Choice
Analyze scatterplots and correlation coefficients.
-The scatterplot shows monthly sales figures (in units) and number of months of
Experience for a sample of salespeople. The association between monthly sales and level
Of experience can be described as 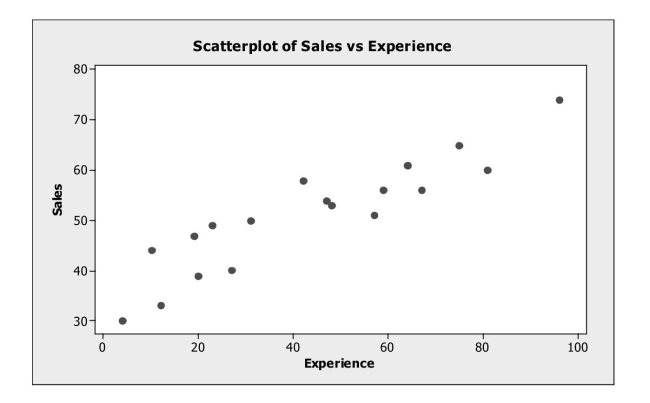
A) positive and weak.
B) negative and weak.
C) negative and strong.
D) positive and strong.
E) nonlinear.
Correct Answer:

Verified
Correct Answer:
Verified
Q3: Understand the relationship between the correlation and
Q4: Use the following to answer questions
Q4: Consider the following to answer the question(s)
Q6: Analyze residuals.<br>-Based on the following residual plot,
Q7: Interpret a linear regression equation and use
Q10: Use the following to answer questions
Q11: Analyze scatterplots and correlation coefficients.<br>-A consumer research
Q12: Analyze scatterplots and correlation coefficients.<br>-The scatterplot shows
Q17: Consider the following to answer the question(s)
Q22: Consider the following to answer the question(s)