Multiple Choice
Analyze scatterplots and correlation coefficients.
-A consumer research group examining the relationship between the price of meat (per
Pound) and fat content (in grams) gathered data that produced the following scatterplot.
If the point in the lower left hand corner (2 grams of fat; $3.00 per pound) is removed, the
Correlation would most likely 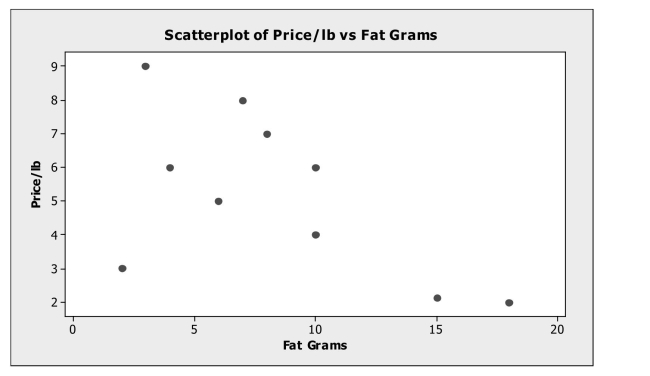
A) remain the same.
B) become positive.
C) become weaker negative.
D) become stronger negative.
E) become zero.
Correct Answer:

Verified
Correct Answer:
Verified
Q4: Consider the following to answer the question(s)
Q6: Analyze residuals.<br>-Based on the following residual plot,
Q7: Interpret a linear regression equation and use
Q8: Analyze scatterplots and correlation coefficients.<br>-The scatterplot shows
Q10: Use the following to answer questions
Q12: Analyze scatterplots and correlation coefficients.<br>-The scatterplot shows
Q14: Check conditions for correlation and linear regression.<br>-A
Q15: Interpret the value of correlation coefficients
Q16: Assign roles to variables.<br>-A study examined consumption
Q22: Consider the following to answer the question(s)