Multiple Choice
Analyze scatterplots and correlation coefficients.
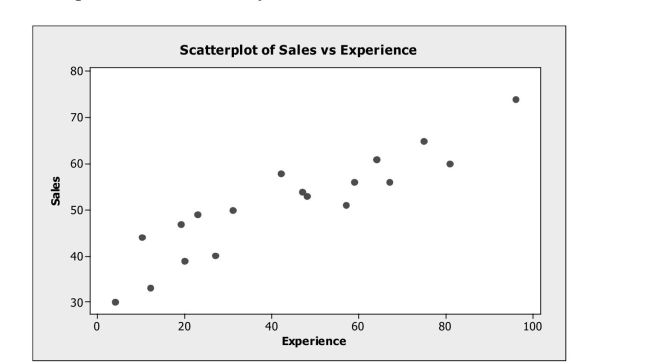
-The scatterplot shows monthly sales figures (in units) and number of months of
Experience for a sample of salespeople. The correlation between monthly sales and level
Of experience is most likely 
A) -.235.
B) 0.
C) .180.
D) -.914.
E) .914.
Correct Answer:

Verified
Correct Answer:
Verified
Q4: Consider the following to answer the question(s)
Q7: Interpret a linear regression equation and use
Q8: Analyze scatterplots and correlation coefficients.<br>-The scatterplot shows
Q10: Use the following to answer questions
Q11: Analyze scatterplots and correlation coefficients.<br>-A consumer research
Q14: Check conditions for correlation and linear regression.<br>-A
Q15: Interpret the value of correlation coefficients
Q16: Assign roles to variables.<br>-A study examined consumption
Q21: Consider the following to answer the question(s)
Q22: Consider the following to answer the question(s)