Multiple Choice
SCENARIO 2-16
The figure below is the percentage polygon for the amount of calories for a sample of 36 pizzas
products where the upper limits of the intervals are: 310, 340, 370, 400 and 430. 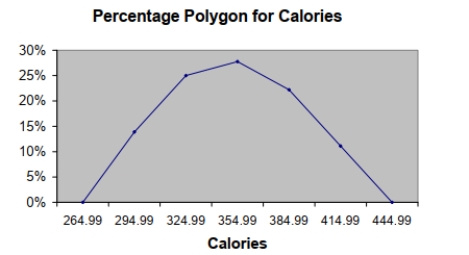
-Referring to Scenario 2-16, roughlyCalories what percentage of pizza products contains between 400 and 430 calories?
A) 0%
B) 11%
C) 89%
D) 100%
Correct Answer:

Verified
Correct Answer:
Verified
Q14: In general,grouped frequency distributions should have between
Q19: SCENARIO 2-12<br>The table below contains the opinions
Q27: The Guidelines for Developing Visualizations recommend always
Q79: You have collected information on the consumption
Q94: Given below is the scatter plot of
Q95: SCENARIO 2-20-A<br>A recent consumer survey on
Q99: When you work with many variables,you must
Q105: SCENARIO 2-5<br>The following are the duration in
Q109: SCENARIO 2-17<br>The following table presents total retail
Q128: When constructing a frequency distribution,classes should be