True/False
Given below is the scatter plot of the number of employees and the total revenue
($millions) of 20 U.S. companies. There appears to be a positive relationship between total
revenue and the number of employees. 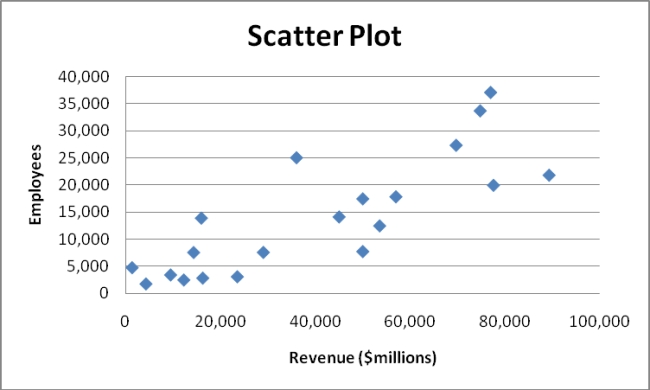
Correct Answer:

Verified
Correct Answer:
Verified
Q19: SCENARIO 2-12<br>The table below contains the opinions
Q27: The Guidelines for Developing Visualizations recommend always
Q61: SCENARIO 2-10<br>The histogram below represents scores achieved
Q87: SCENARIO 2-14 <br>The table below contains the
Q90: SCENARIO 2-20-B<br>A recent consumer survey on
Q95: SCENARIO 2-20-A<br>A recent consumer survey on
Q98: SCENARIO 2-16<br>The figure below is the percentage
Q109: SCENARIO 2-17<br>The following table presents total retail
Q128: When constructing a frequency distribution,classes should be
Q181: SCENARIO 2-5<br>The following are the duration in