Multiple Choice
The line graph shows the recorded hourly temperatures in degrees Fahrenheit at an airport. 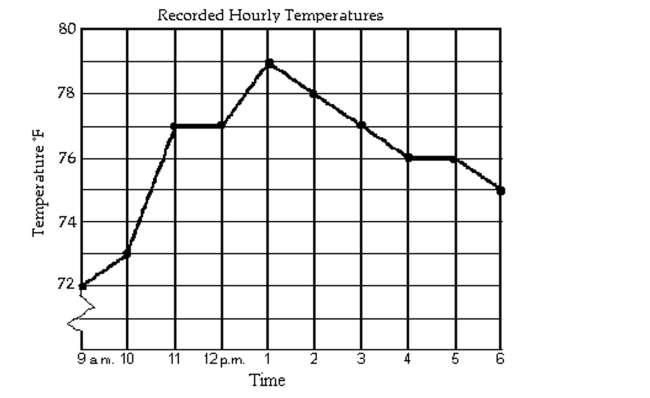
-At what times was the temperature below 77°F?
A) from 12 p.m. until 3 p.m
B) from 9 a.m. until 12 p.m. and from 3 p.m. until 6 p.m.
C) from 9 a.m. until 11 a.m. and from 3 p.m. until 6 p.m.
D) after 3 p.m.
Correct Answer:

Verified
Correct Answer:
Verified
Q519: Find the average rate of change illustrated
Q520: Match the description with the correct
Q521: Decide whether the relation defines a
Q522: Determine whether <span class="ql-formula" data-value="(
Q523: Select the equation that describes the
Q525: Select the equation that describes the
Q526: Determine whether the three points are
Q527: Find the slope of the line
Q528: The graph of a linear function
Q529: Use the graph to solve the problem.<br>-The