Multiple Choice
Select the equation that describes the graph shown. 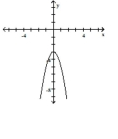
A)
B)
C)
D)
Correct Answer:

Verified
Correct Answer:
Verified
Related Questions
Q518: Describe how the graph of the
Q519: Find the average rate of change illustrated
Q520: Match the description with the correct
Q521: Decide whether the relation defines a
Q522: Determine whether <span class="ql-formula" data-value="(
Q524: The line graph shows the recorded hourly
Q525: Select the equation that describes the
Q526: Determine whether the three points are
Q527: Find the slope of the line
Q528: The graph of a linear function