Multiple Choice
Use this graph to answer the question. 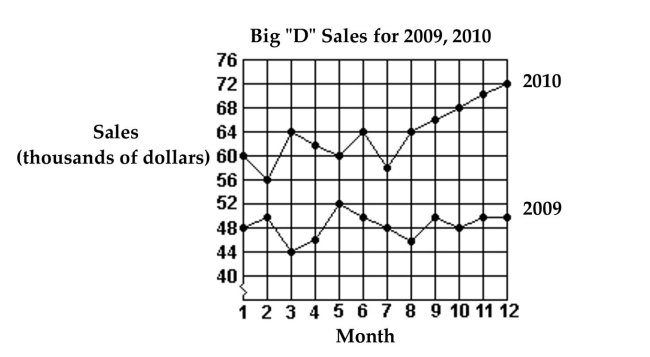
-What month in 2010 had the lowest sales?
A) Month 3
B) Month 5
C) Month 2
D) Month 12
Correct Answer:

Verified
Correct Answer:
Verified
Related Questions
Q86: Make a bar graph to represent
Q87: Use the information to complete a
Q88: Use the information to complete a
Q89: Construct a frequency polygon.<br>- <span class="ql-formula"
Q90: Find the median.<br>-1, 1, 25, 18, 21,
Q92: This double-bar graph shows the number of
Q93: Use this graph to answer the question.
Q94: Use the graph to answer the question.<br>-<img
Q95: Use the graph to answer the question.<br>-<img
Q96: A car insurance company conducted a