Multiple Choice
Use this graph to answer the question. 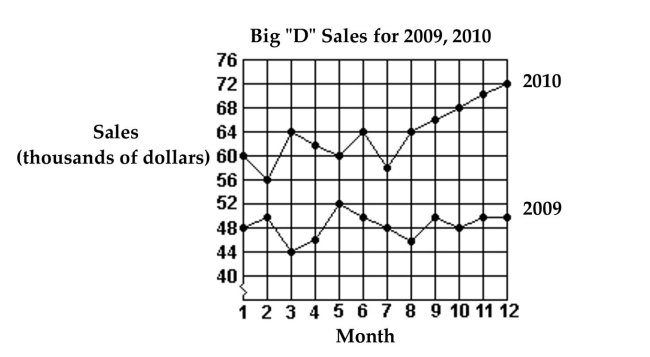
-What was the total increase in sales for the first 6 months from 2009 to 2010?
A) $18,000
B) $652,000
C) $12,000
D) $76,000
Correct Answer:

Verified
Correct Answer:
Verified
Related Questions
Q88: Use the information to complete a
Q89: Construct a frequency polygon.<br>- <span class="ql-formula"
Q90: Find the median.<br>-1, 1, 25, 18, 21,
Q91: Use this graph to answer the question.
Q92: This double-bar graph shows the number of
Q94: Use the graph to answer the question.<br>-<img
Q95: Use the graph to answer the question.<br>-<img
Q96: A car insurance company conducted a
Q97: In a school survey, students showed these
Q98: Construct a frequency polygon.<br>- <span class="ql-formula"