Multiple Choice
Use the graph to answer the question.
-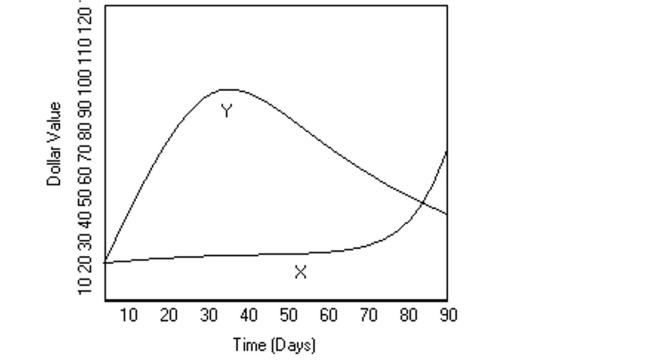 Mike decides to buy shares of companies X and Y, which were initially selling for the same price. The changes in each stock's value over 90 days are shown in the graph above. When did the two
Stocks have the same value, other than when he bought them?
A) day 80
B) day 50
C) day 85
D) day 90
Correct Answer:

Verified
Correct Answer:
Verified
Q90: Find the median.<br>-1, 1, 25, 18, 21,
Q91: Use this graph to answer the question.
Q92: This double-bar graph shows the number of
Q93: Use this graph to answer the question.
Q94: Use the graph to answer the question.<br>-<img
Q96: A car insurance company conducted a
Q97: In a school survey, students showed these
Q98: Construct a frequency polygon.<br>- <span class="ql-formula"
Q99: Find the median for the given sample
Q100: This double-bar graph shows the number of