Multiple Choice
This double-bar graph shows the number of male (M) and female (F) athletes at a university over a four-year period.
Answer the question. 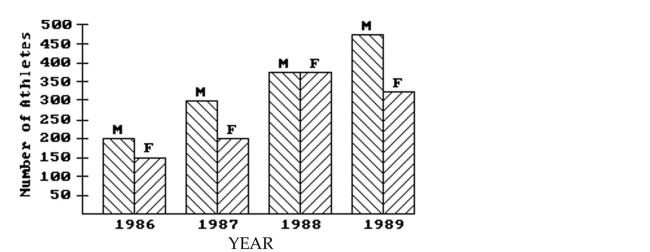
-What percentage of all students involved in athletics in 1989 was male? (Round to the nearest percent.)
A) 41%
B) 35%
C) 59%
D) 68%
Correct Answer:

Verified
Correct Answer:
Verified
Related Questions
Q95: Use the graph to answer the question.<br>-<img
Q96: A car insurance company conducted a
Q97: In a school survey, students showed these
Q98: Construct a frequency polygon.<br>- <span class="ql-formula"
Q99: Find the median for the given sample
Q101: Find the mean for the given
Q102: Find the median for the given
Q103: In a school survey, students showed these
Q104: This double-bar graph shows the number of
Q105: Find the mean for the given