Multiple Choice
Solve the problem.
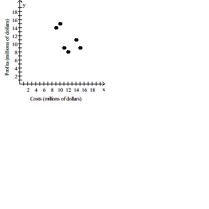
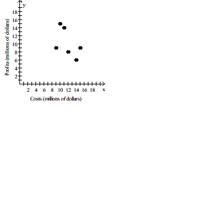
-The table below shows the legal costs and the profits of a company from 2000 to 2005. Construct a scatter diagram for the data and state whether legal costs and profits for this company have no correlation, a positive correlation, or a negative correlation for this period.
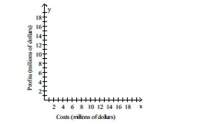
A) Positive correlation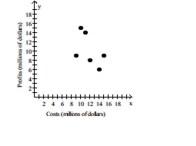
B) Positive correlation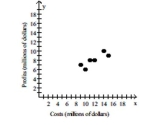
C) No correlation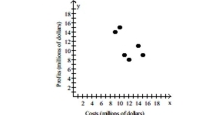
D) Negative correlation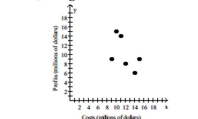
Correct Answer:

Verified
Correct Answer:
Verified
Q39: Construct a scatter diagram with several groups
Q40: Determine whether the stated causal connection is
Q41: To get the best deal on
Q42: Answer the question using the value of
Q43: Select the best estimate of the correlation
Q45: Solve the problem. Round your answers
Q46: State whether you believe the two variables
Q47: Write possible coordinates for both outliers so
Q48: State whether you believe the two variables
Q49: How does the outlier affect the correlation