Multiple Choice
Answer the question using the value of r and the given best-fit line on the scatter diagram.
-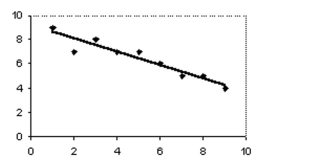 The scatter diagram and best-fit line show the data for price per item (y) and the availability of that item (x) . The correlation coefficient r is -0.95. Predict the price per item for an availability of 3.
A) 7.8
B) 6.8
C) No valid prediction is possible.
D) 8.8
Correct Answer:

Verified
Correct Answer:
Verified
Q37: The table contains the weights (in
Q38: Answer the question using the value of
Q39: Construct a scatter diagram with several groups
Q40: Determine whether the stated causal connection is
Q41: To get the best deal on
Q43: Select the best estimate of the correlation
Q44: Solve the problem.<br>-The table below shows
Q45: Solve the problem. Round your answers
Q46: State whether you believe the two variables
Q47: Write possible coordinates for both outliers so