Multiple Choice
Solve the problem. Round your answers to the nearest whole percent.
-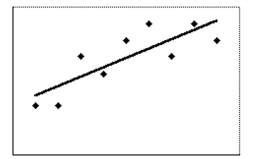
The scatter diagram shows the data for the prices of a stock (y) and U.S. employment (x) . The correlation coeffici . Determine how much of the variation in the stock price can be accounted for by the best-fit line.
A)
B)
C)
D) cient r is
Correct Answer:

Verified
Correct Answer:
Verified
Q18: Solve the problem.<br>-A study found a strong
Q19: Answer the question using the value of
Q20: Solve the problem.<br>-A local highway has an
Q21: Write possible coordinates for the single outlier
Q22: Select the best-fit line for the
Q24: Answer the question using the value of
Q25: State whether you believe the two variables
Q26: Solve the problem.<br>-There is a strong correlation
Q27: The table contains the weights (in
Q28: Select the best-fit line for the