Multiple Choice
Answer the question using the value of r and the given best-fit line on the scatter diagram.
-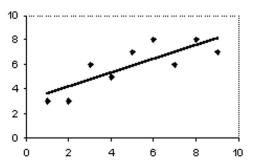
The scatter diagram and best-fit line show the data for the price of a stock (y) and U.S. employment (x) . The correlation coefficient r is 0.8. Predict the stock price for an employment value of 11.
A) 9.8
B) 9
C) 8
D) No valid prediction is possible.
Correct Answer:

Verified
Correct Answer:
Verified
Q19: Answer the question using the value of
Q20: Solve the problem.<br>-A local highway has an
Q21: Write possible coordinates for the single outlier
Q22: Select the best-fit line for the
Q23: Solve the problem. Round your answers
Q25: State whether you believe the two variables
Q26: Solve the problem.<br>-There is a strong correlation
Q27: The table contains the weights (in
Q28: Select the best-fit line for the
Q29: Determine whether the stated causal connection is