Multiple Choice
Answer the question using the value of r and the given best-fit line on the scatter diagram.
-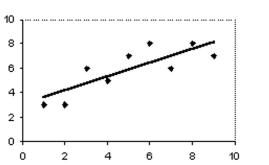 The scatter diagram and best-fit line show the data for the price of a stock (y) and U.S. employment (x) . The correlation coefficient r is 0.8. Predict the stock price for an employment value of 5.
A) 5.9
B) 4.9
C) 7
D) No valid prediction is possible.
Correct Answer:

Verified
Correct Answer:
Verified
Q14: State whether there is no correlation, a
Q15: State whether there is no correlation, a
Q16: Construct a scatter diagram with several groups
Q17: Construct a scatter diagram with two groups
Q18: Solve the problem.<br>-A study found a strong
Q20: Solve the problem.<br>-A local highway has an
Q21: Write possible coordinates for the single outlier
Q22: Select the best-fit line for the
Q23: Solve the problem. Round your answers
Q24: Answer the question using the value of