Multiple Choice
Construct a line chart for the data.
-The ages of employees of a company are summarized in the frequency table. 
A) 
Age (years)
B) 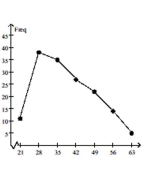
Age (years)
C) 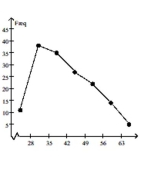
Age (years)
D) None of the above
Correct Answer:

Verified
Correct Answer:
Verified
Related Questions
Q66: Solve the problem.<br>-Use the high closing
Q67: A nurse measured the blood pressure of
Q68: The bar graph below shows the average
Q69: Use the graph to answer the question.<br>-<img
Q71: Provide an appropriate response.<br>-Suppose that a
Q72: A television manufacturer sold three times as
Q73: The following data represent the total
Q74: The graph below shows estimated world
Q75: Provide an appropriate response.<br>-Suppose that you
Q182: Provide an appropriate response.<br>-Construct a frequency table