Multiple Choice
Use the graph to answer the question.
-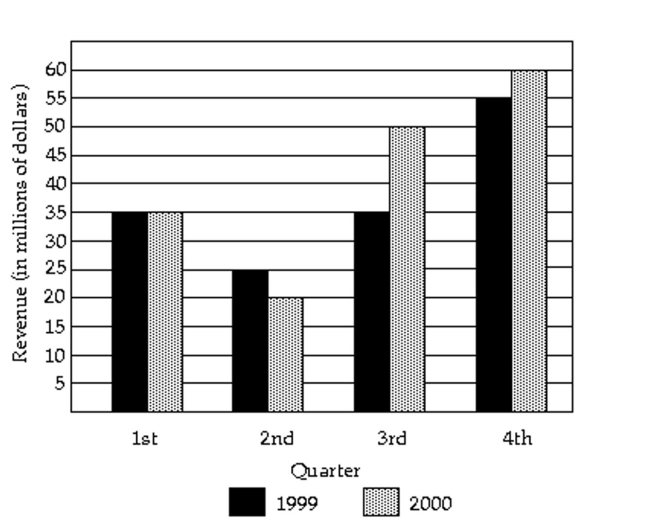
What was the revenue for the first quarter of 1999?
A) $7 million
B) $4 million
C) $35 million
D) $20 million
Correct Answer:

Verified
Correct Answer:
Verified
Related Questions
Q64: Solve the problem.<br>-The following data show
Q66: Solve the problem.<br>-Use the high closing
Q67: A nurse measured the blood pressure of
Q68: The bar graph below shows the average
Q70: Construct a line chart for the
Q71: Provide an appropriate response.<br>-Suppose that a
Q72: A television manufacturer sold three times as
Q73: The following data represent the total
Q74: The graph below shows estimated world
Q182: Provide an appropriate response.<br>-Construct a frequency table