Multiple Choice
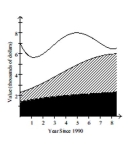
The stacked line chart shows the value of each of Danny's investments. The stacked line chart contains three regions. The uppermost unshaded region represents the value of Danny's investment in individual stocks. The center shaded region represents the value of Danny's investment in mutual funds and the bottom region in black represents the value of Danny's investment in a CD. The thickness of a region at a particular time tells you its value at that time.  Use the graph to answer the question.
-In the year 1990, approximately what percentage of Danny's total investment was in the CD?
A) 25%
B) 15%
C) 30%
D) 20%
Correct Answer:

Verified
Correct Answer:
Verified
Q39: Make a bar graph to represent
Q40: Solve the problem.<br>-The weights of 22
Q41: Use the graph to answer the question.<br>-<img
Q42: A nurse measured the blood pressure of
Q43: A parcel delivery service lowered its prices
Q45: A nurse measured the blood pressure of
Q46: Construct a frequency table for the
Q47: Construct a pie chart representing the
Q48: Answer the question using the graphical display.
Q49: A nurse measured the blood pressure of