Multiple Choice
Use the graph to answer the question.
-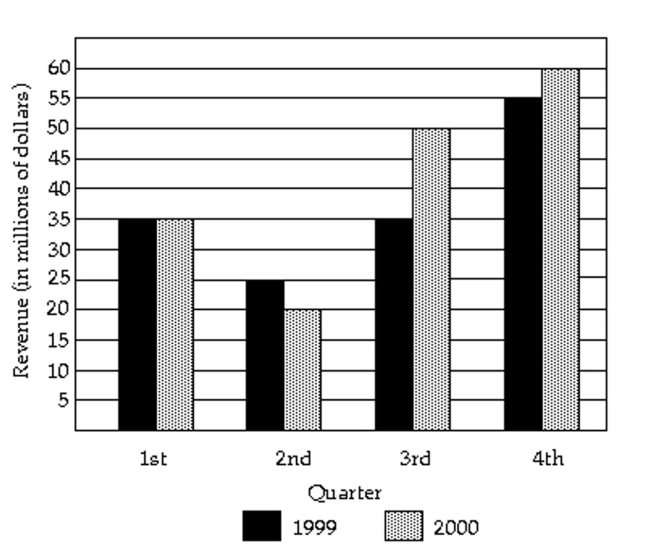
In what quarter was the revenue the least for 2000?
A) fourth quarter
B) third quarter
C) first quarter
D) second quarter
Correct Answer:

Verified
Correct Answer:
Verified
Related Questions
Q36: The stacked line chart shows the value
Q37: Solve the problem.<br>-A car dealer is
Q38: Provide an appropriate response.<br>-Construct a cumulative
Q39: Make a bar graph to represent
Q40: Solve the problem.<br>-The weights of 22
Q42: A nurse measured the blood pressure of
Q43: A parcel delivery service lowered its prices
Q44: The stacked line chart shows the value
Q45: A nurse measured the blood pressure of
Q46: Construct a frequency table for the