Essay
The bar graph below shows the number of car accidents occurring in one city in each of the years 2001 through 2006. The number of accidents dropped in 2003 after a new speed limit was imposed. Why is the graph misleading? How would you redesign the graph so that it is less misleading? What impression is conveyed by
the graph? 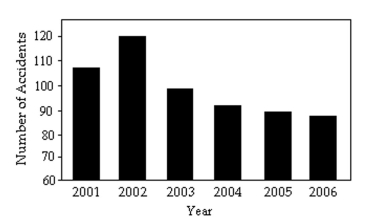
Correct Answer:

Verified
The graph is misleading because it is tr...View Answer
Unlock this answer now
Get Access to more Verified Answers free of charge
Correct Answer:
Verified
View Answer
Unlock this answer now
Get Access to more Verified Answers free of charge
Q30: The stacked line chart shows the value
Q31: Create a graphical display for the
Q33: Make a bar graph to represent
Q34: Construct the requested table. Round relative
Q36: The stacked line chart shows the value
Q37: Solve the problem.<br>-A car dealer is
Q38: Provide an appropriate response.<br>-Construct a cumulative
Q39: Make a bar graph to represent
Q40: Solve the problem.<br>-The weights of 22
Q119: Explain in your own words the difference