Multiple Choice
Solve the problem.
-A car dealer is deciding what kinds of vehicles he should order from the factory. His sales report for the preceding period is shown below. Construct a Pareto chart to represent the sales of each type of vehicle as percentages.
A) 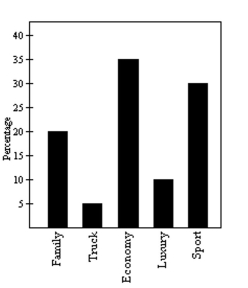
B) 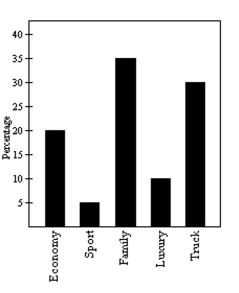
C) 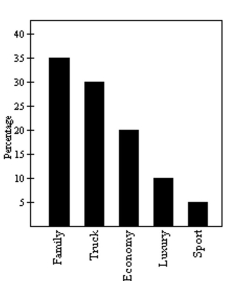
D) 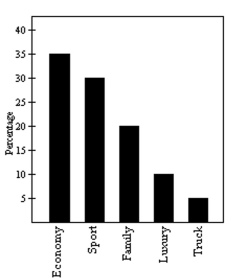
Correct Answer:

Verified
Correct Answer:
Verified
Related Questions
Q33: Make a bar graph to represent
Q34: Construct the requested table. Round relative
Q35: The bar graph below shows the number
Q36: The stacked line chart shows the value
Q38: Provide an appropriate response.<br>-Construct a cumulative
Q39: Make a bar graph to represent
Q40: Solve the problem.<br>-The weights of 22
Q41: Use the graph to answer the question.<br>-<img
Q42: A nurse measured the blood pressure of
Q119: Explain in your own words the difference