Multiple Choice
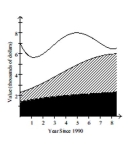
The stacked line chart shows the value of each of Danny's investments. The stacked line chart contains three regions. The uppermost unshaded region represents the value of Danny's investment in individual stocks. The center shaded region represents the value of Danny's investment in mutual funds and the bottom region in black represents the value of Danny's investment in a CD. The thickness of a region at a particular time tells you its value at that time.  Use the graph to answer the question.
-In which year was the total value of Danny's investments the least?
A) 1998
B) 1990
C) 1993
D) 1991
Correct Answer:

Verified
Correct Answer:
Verified
Q31: Create a graphical display for the
Q33: Make a bar graph to represent
Q34: Construct the requested table. Round relative
Q35: The bar graph below shows the number
Q37: Solve the problem.<br>-A car dealer is
Q38: Provide an appropriate response.<br>-Construct a cumulative
Q39: Make a bar graph to represent
Q40: Solve the problem.<br>-The weights of 22
Q41: Use the graph to answer the question.<br>-<img
Q119: Explain in your own words the difference