Essay
Use the graph to answer the question.
-The bar graph below shows the relative frequencies of the different blood types. Write a
sentence describing what is revealed by the graph. 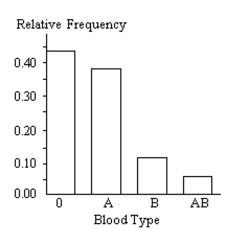
Correct Answer:

Verified
The majority of people have ei...View Answer
Unlock this answer now
Get Access to more Verified Answers free of charge
Correct Answer:
Verified
View Answer
Unlock this answer now
Get Access to more Verified Answers free of charge
Q46: A statement is made about correlation. State
Q47: Answer as requested.<br>-Which of the following pairs
Q48: Answer the question.<br>-Which of the following describes
Q49: State whether you think that the variables
Q50: Use the indicated bin size to
Q52: Make a scatter diagram for the
Q53: Use the graph to answer the question.<br>-<img
Q54: Construct a pie chart representing the
Q55: Provide an appropriate response.<br>-Suppose that you construct
Q56: Answer the question.<br>-Which of the following describes