Essay
Use the graph to answer the question.
-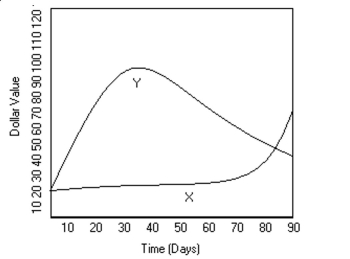 Mike decides to buy shares of companies X and Y, which were initially selling for the same
price. The changes in the value of each stock over a 90-day period are shown in the graph
above. Describe the trend in the value of each stock over the 90-day period.
Correct Answer:

Verified
The value of stock Y increased sharply i...View Answer
Unlock this answer now
Get Access to more Verified Answers free of charge
Correct Answer:
Verified
View Answer
Unlock this answer now
Get Access to more Verified Answers free of charge
Q48: Answer the question.<br>-Which of the following describes
Q49: State whether you think that the variables
Q50: Use the indicated bin size to
Q51: Use the graph to answer the question.<br>-The
Q52: Make a scatter diagram for the
Q54: Construct a pie chart representing the
Q55: Provide an appropriate response.<br>-Suppose that you construct
Q56: Answer the question.<br>-Which of the following describes
Q57: Use the graph to answer the question.<br>-<img
Q58: Use the indicated bin size to