Multiple Choice
Make a scatter diagram for the data.
-The following table gives the total sales (revenue) and profits for 8 retailers. 
A) 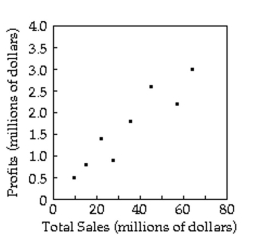
B) 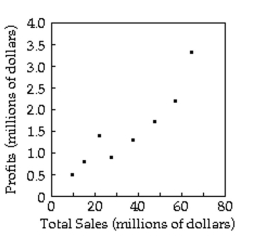
C) 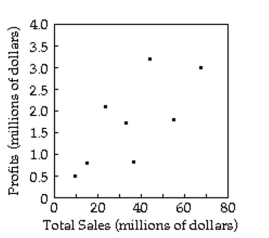
D) 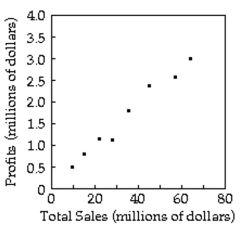
Correct Answer:

Verified
Correct Answer:
Verified
Related Questions
Q47: Answer as requested.<br>-Which of the following pairs
Q48: Answer the question.<br>-Which of the following describes
Q49: State whether you think that the variables
Q50: Use the indicated bin size to
Q51: Use the graph to answer the question.<br>-The
Q53: Use the graph to answer the question.<br>-<img
Q54: Construct a pie chart representing the
Q55: Provide an appropriate response.<br>-Suppose that you construct
Q56: Answer the question.<br>-Which of the following describes
Q57: Use the graph to answer the question.<br>-<img