Essay
Answer the question.
-The graph below shows estimated world population for the period 4000 BC Note that the logarithm of the world population and not actual population is plotted on
the vertical axis. This means, for example, that when the graph reaches 7 on the vertical
scale, world population is and when the graph reaches 9 on the vertical scale, world
population is . 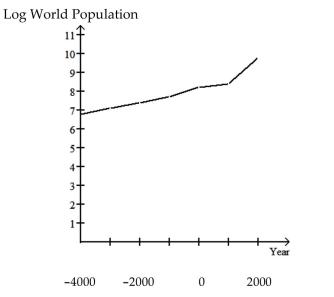 Why must the graph be interpreted with care? If the graph is not interpreted with care
what misleading impression might one have of world population during the period 4000
BC - 2000 AD? Why do you think that the graph was presented in this form?
Correct Answer:

Verified
The graph must be interpreted with care ...View Answer
Unlock this answer now
Get Access to more Verified Answers free of charge
Correct Answer:
Verified
View Answer
Unlock this answer now
Get Access to more Verified Answers free of charge
Q184: Describe how you would apply the five
Q185: Answer as requested.<br>-Which of the following is
Q186: Answer the question.<br>-Which of the following describes
Q187: The stack plot below shows the value
Q188: Construct a line chart for the
Q190: The stack plot below shows the value
Q191: Create a graphical display for the
Q192: Choose the best wording for the question
Q193: Use the indicated bin size to
Q194: State whether the scatter diagram shows strong