Multiple Choice
The stack plot below shows the value of each of Danny's investments. The stack plot contains three regions. Theuppermost unshaded region represents the value of Danny's investment in individual stocks. The center shaded regionrepresents the value of Danny's investment in mutual funds and the bottom region in black represents the value ofDanny's investment in a CD. The thickness of a region at a particular time tells you its value at that time. 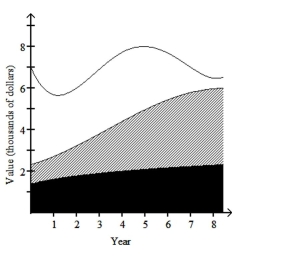 Use the graph to answer the question.
-In year 8, approximately what percentage of Danny's total investment was in mutual funds?
A) 60%
B) 50%
C) 80%
D) 70%
Correct Answer:

Verified
Correct Answer:
Verified
Q182: Provide an appropriate response.<br>-Construct a frequency table
Q183: Use the graph to answer the question.<br>-<img
Q184: Describe how you would apply the five
Q185: Answer as requested.<br>-Which of the following is
Q186: Answer the question.<br>-Which of the following describes
Q188: Construct a line chart for the
Q189: Answer the question.<br>-The graph below shows
Q190: The stack plot below shows the value
Q191: Create a graphical display for the
Q192: Choose the best wording for the question