Multiple Choice
The stack plot below shows the value of each of Danny's investments. The stack plot contains three regions. Theuppermost unshaded region represents the value of Danny's investment in individual stocks. The center shaded regionrepresents the value of Danny's investment in mutual funds and the bottom region in black represents the value ofDanny's investment in a CD. The thickness of a region at a particular time tells you its value at that time. 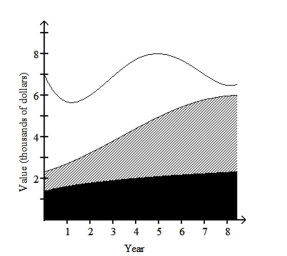 Use the graph to answer the question.
-In which year was the total value of Danny's investments the greatest?
A) year 5
B) year 0
C) year 4
D) year 8
Correct Answer:

Verified
Correct Answer:
Verified
Q185: Answer as requested.<br>-Which of the following is
Q186: Answer the question.<br>-Which of the following describes
Q187: The stack plot below shows the value
Q188: Construct a line chart for the
Q189: Answer the question.<br>-The graph below shows
Q191: Create a graphical display for the
Q192: Choose the best wording for the question
Q193: Use the indicated bin size to
Q194: State whether the scatter diagram shows strong
Q195: The stack plot below shows the value