Multiple Choice
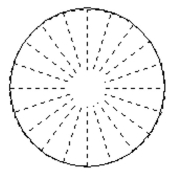
Construct a pie chart representing the given data set.
- 
A) 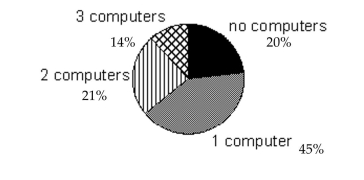
B) 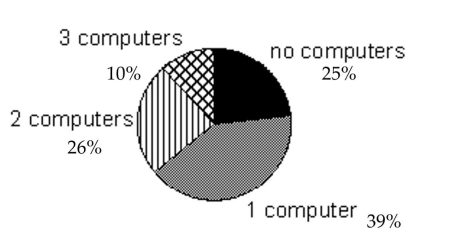
C) 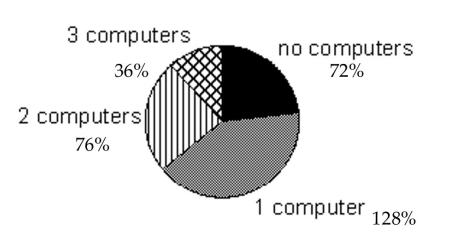
D) 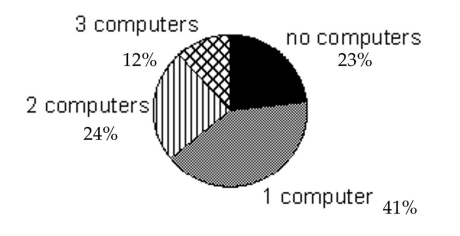
Correct Answer:

Verified
Correct Answer:
Verified
Related Questions
Q6: Use the guidelines to evaluate the study.
Q7: In order to answer the given question,
Q8: The stack plot below shows the value
Q9: Use the guidelines to evaluate the study.
Q11: Use the guidelines to evaluate the study.
Q12: Use the guidelines to evaluate the study.
Q13: The stack plot below shows the value
Q14: Solve the problem.<br>-A researcher finds a negative
Q15: State whether the scatter diagram shows strong
Q119: Explain in your own words the difference