Multiple Choice
The stack plot below shows the value of each of Danny's investments. The stack plot contains three regions. Theuppermost unshaded region represents the value of Danny's investment in individual stocks. The center shaded regionrepresents the value of Danny's investment in mutual funds and the bottom region in black represents the value ofDanny's investment in a CD. The thickness of a region at a particular time tells you its value at that time. 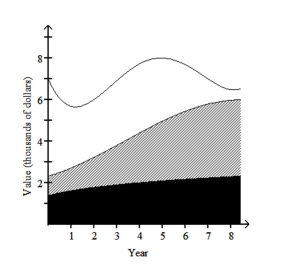 Use the graph to answer the question.
-In which year was the total value of Danny's investments the least?
A) year 0
B) year 8
C) year 1
D) year 3
Correct Answer:

Verified
Correct Answer:
Verified
Q3: The graph below shows estimated world
Q4: Describe how you would apply the five
Q6: Use the guidelines to evaluate the study.
Q7: In order to answer the given question,
Q9: Use the guidelines to evaluate the study.
Q10: Construct a pie chart representing the
Q11: Use the guidelines to evaluate the study.
Q12: Use the guidelines to evaluate the study.
Q13: The stack plot below shows the value
Q119: Explain in your own words the difference