Multiple Choice
The stack plot below shows the value of each of Danny's investments. The stack plot contains three regions. Theuppermost unshaded region represents the value of Danny's investment in individual stocks. The center shaded regionrepresents the value of Danny's investment in mutual funds and the bottom region in black represents the value ofDanny's investment in a CD. The thickness of a region at a particular time tells you its value at that time. 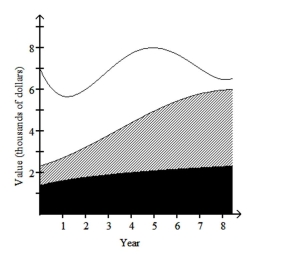 Use the graph to answer the question.
-In which year was the value of Danny's investment in individual stocks the highest?
A) year 4
B) year 0
C) year 5
D) year 8
Correct Answer:

Verified
Correct Answer:
Verified
Q8: The stack plot below shows the value
Q9: Use the guidelines to evaluate the study.
Q10: Construct a pie chart representing the
Q11: Use the guidelines to evaluate the study.
Q12: Use the guidelines to evaluate the study.
Q14: Solve the problem.<br>-A researcher finds a negative
Q15: State whether the scatter diagram shows strong
Q16: In order to answer the given question,
Q17: Answer the question.<br>-Which of the following quantities
Q18: Describe how you would apply the five