Essay
The graph below is a residual plot for a set of regression data. Does the graph suggest violation of one or more of the assumptions for regression inferences? Explain your answer. 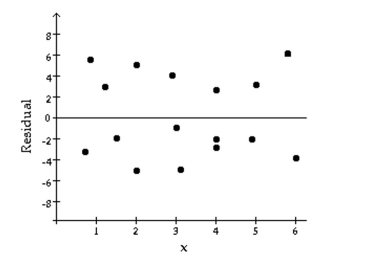
Correct Answer:

Verified
Correct Answer:
Verified
Related Questions
Q2: In the context of regression, explain the
Q3: What would you expect for the linear
Q4: In the correlation test for normality, the
Q5: <span class="ql-formula" data-value="\text { In the context
Q6: The correlation test for normality involves computing
Q7: A researcher is interested in the relationship
Q8: Construct a residual plot for the
Q9: Construct a normal probability plot of
Q10: Construct a normal probability plot of
Q11: In a study of the relationship between