Multiple Choice
SCENARIO 2-15
The figure below is the ogive for the amount of fat (in grams) for a sample of 36 pizza products
where the upper boundaries of the intervals are: 5, 10, 15, 20, 25, and 30. 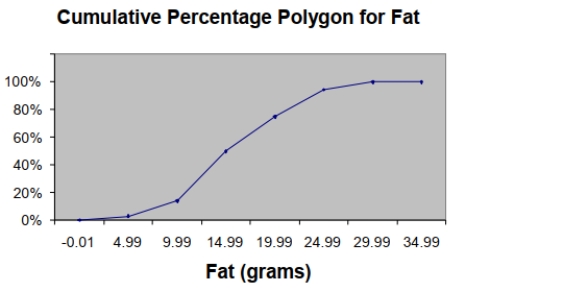
-Referring to Scenario 2-15, what percentage of pizza products contains between 10 and 25
Grams of fat?
A) 14%
B) 44%
C) 62%
D) 81%
Correct Answer:

Verified
Correct Answer:
Verified
Q64: When polygons or histograms are constructed,which axis
Q132: SCENARIO 2-10<br>The histogram below represents scores achieved
Q143: SCENARIO 2-8<br>The Stem-and-Leaf display represents the number
Q159: True or False: Ogives are plotted at
Q160: SCENARIO 2-12<br>The table below contains the opinions
Q161: In order to compare one large set
Q165: SCENARIO 2-16<br>The figure below is the percentage
Q166: True or False: The Guidelines for Developing
Q167: SCENARIO 2-12<br>The table below contains the opinions
Q168: True or False: The main principle behind