Multiple Choice
SCENARIO 2-16
The figure below is the percentage polygon for the amount of calories for a sample of 36 pizzas
products where the upper limits of the intervals are: 310, 340, 370, 400 and 430.
Percentage Polygon for Calories 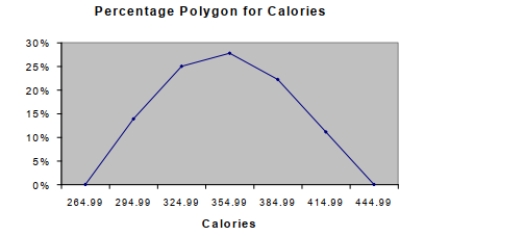
-Referring to Scenario 2-16, roughly what percentage of pizza products contains between 340
And 400 calories?
A) 22%
B) 25%
C) 28%
D) 50%
Correct Answer:

Verified
Correct Answer:
Verified
Q65: SCENARIO 2-10<br>The histogram below represents scores achieved
Q97: SCENARIO 2-8<br>The Stem-and-Leaf display represents the number
Q132: SCENARIO 2-10<br>The histogram below represents scores achieved
Q143: SCENARIO 2-8<br>The Stem-and-Leaf display represents the number
Q160: SCENARIO 2-12<br>The table below contains the opinions
Q161: In order to compare one large set
Q163: SCENARIO 2-15<br>The figure below is the ogive
Q166: True or False: The Guidelines for Developing
Q167: SCENARIO 2-12<br>The table below contains the opinions
Q168: True or False: The main principle behind