Multiple Choice
260 randomly sampled college students were asked, among other things, to state their year in school (freshman, sophomore, junior, or senior) . The responses are shown in the bar graph below.
How many of the students who responded would be classified as upperclassmen (e.g., juniors or
Seniors) ? 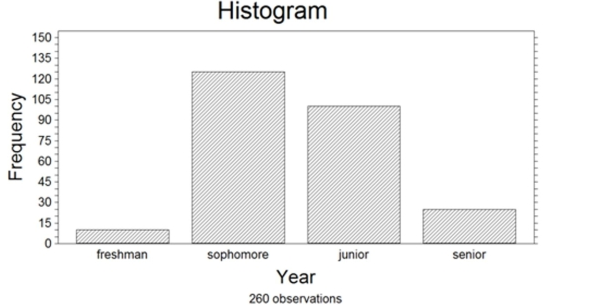
A) Approximately 10
B) Approximately 25
C) Approximately 100
D) Approximatley 125
Correct Answer:

Verified
Correct Answer:
Verified
Q8: Compute <span class="ql-formula" data-value="\mathrm {
Q9: The slices of a pie chart must
Q10: The amount spent on textbooks for the
Q11: 252 randomly sampled college students were asked,
Q12: A study was designed to investigate the
Q14: The distribution of salaries of professional basketball
Q15: A standardized test has a mean score
Q16: The bars in a bar graph can
Q17: The calculator screens summarize a data set.
Q18: <img src="https://d2lvgg3v3hfg70.cloudfront.net/TB34225555/.jpg" alt=" The bar graph