Essay
The calculator screens summarize a data set. 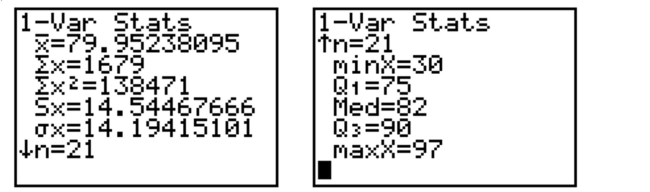 a. Identify the lower and upper quartiles of the data set.
b. Find the interquartile range.
c. Is there reason to suspect that the data may contain an outlier? Explain.
Correct Answer:

Verified
a. lower quartile: Q 1=75 ; upper quarti...View Answer
Unlock this answer now
Get Access to more Verified Answers free of charge
Correct Answer:
Verified
View Answer
Unlock this answer now
Get Access to more Verified Answers free of charge
Q12: A study was designed to investigate the
Q13: 260 randomly sampled college students were asked,
Q14: The distribution of salaries of professional basketball
Q15: A standardized test has a mean score
Q16: The bars in a bar graph can
Q18: <img src="https://d2lvgg3v3hfg70.cloudfront.net/TB34225555/.jpg" alt=" The bar graph
Q19: An annual survey sent to retail
Q20: A frequency table displays the proportion of
Q21: All class intervals in a histogram have
Q22: The mean <span class="ql-formula" data-value="\bar