Multiple Choice
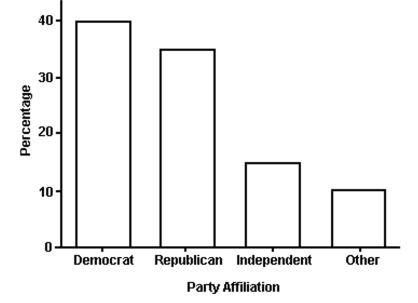
The bar graph shows the political affiliation of 1000 registered U.S. voters. What percentage of the voters belonged to one of the traditional two parties (Democratic or Republican) ?
A) 25%
B) 35%
C) 75%
D) 40%
Correct Answer:

Verified
Correct Answer:
Verified
Related Questions
Q13: 260 randomly sampled college students were asked,
Q14: The distribution of salaries of professional basketball
Q15: A standardized test has a mean score
Q16: The bars in a bar graph can
Q17: The calculator screens summarize a data set.
Q19: An annual survey sent to retail
Q20: A frequency table displays the proportion of
Q21: All class intervals in a histogram have
Q22: The mean <span class="ql-formula" data-value="\bar
Q23: Which of the following is a measure