Multiple Choice
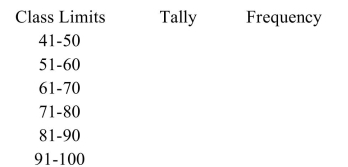
A recent statistics exam yielded the following 25 scores. Construct a grouped frequency distribution with the class limits shown below.
A)
B)
C)
D)
Correct Answer:

Verified
Correct Answer:
Verified
Related Questions
Q73: A pie graph would best represent the
Q74: A stem and leaf plot has the
Q75: The following frequency distribution presents the
Q76: Construct a dotplot for the following
Q77: What is the lower class limit in
Q79: Karen is constructing a pie graph
Q80: <span class="ql-formula" data-value="\begin{array}{l}\text { Given the following
Q81: When data are collected in original form,
Q82: The following time-series plot presents the population
Q83: <span class="ql-formula" data-value="\text { Construct a stem-and-leaf