Multiple Choice
The following time-series plot presents the population growth (in percent) of a suburb of Atlanta, Georgia for each of the years 1990 through 2009. Estimate the amount by which the rate of growth changed from 1993 to 1995 .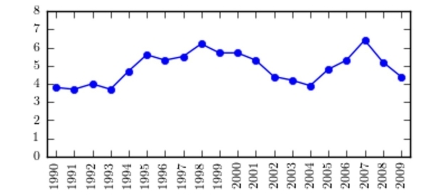
A) about 2.9 percentage points
B) about 2.1 percentage points
C) about 1.4 percentage points
D) about 3.0 percentage points
Correct Answer:

Verified
Correct Answer:
Verified
Q77: What is the lower class limit in
Q78: A recent statistics exam yielded the
Q79: Karen is constructing a pie graph
Q80: <span class="ql-formula" data-value="\begin{array}{l}\text { Given the following
Q81: When data are collected in original form,
Q83: <span class="ql-formula" data-value="\text { Construct a stem-and-leaf
Q84: The frequency polygon and the histogram are
Q85: A sample of 200 high school
Q86: <span class="ql-formula" data-value="\text { Classify the histogram
Q87: The following pie chart presents the percentages