Multiple Choice
Thirty households were surveyed for the number of televisions in each home. Following a results.
Construct a relative frequency histogram.
A) 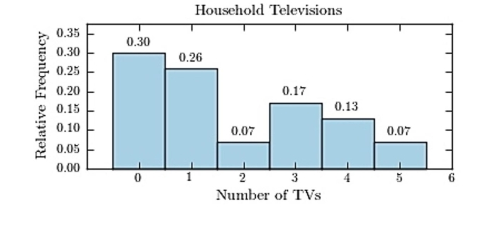
B) 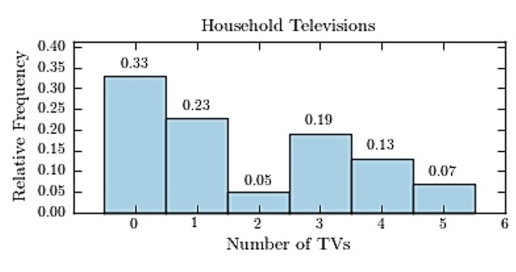
C) 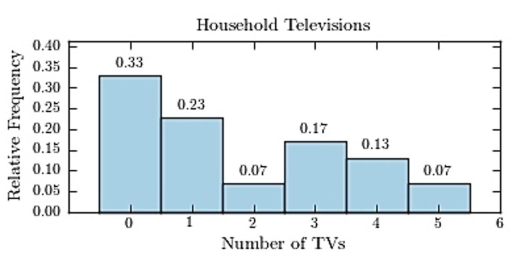
D) 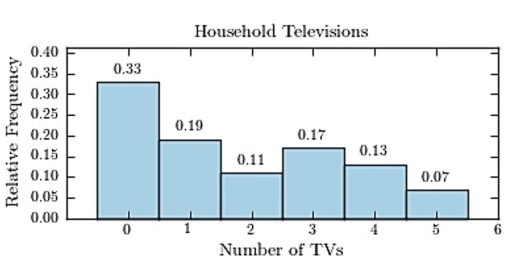
Correct Answer:

Verified
Correct Answer:
Verified
Related Questions
Q1: <span class="ql-formula" data-value="\begin{array}{l}\text { Construct a Pareto
Q2: The following table presents the purchase
Q3: <span class="ql-formula" data-value="\text { Construct a frequency
Q5: The following bar graph presents the average
Q6: If the limits for a class were
Q7: Which of the following pairs of class
Q8: The following frequency distribution presents the
Q9: The following pie chart presents the percentages
Q10: <span class="ql-formula" data-value="\begin{array}{l}\text { Construct a pie
Q11: The following frequency distribution presents the