Multiple Choice
A sample of 200 high school students were asked how many hours per week they spend u television. The following frequency distribution presents the results.
Construct a relative frequency polygon for the frequency distribution.
A) 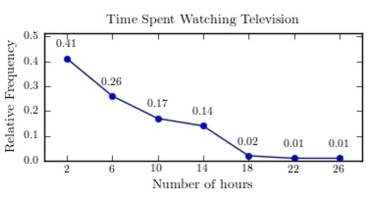
B) 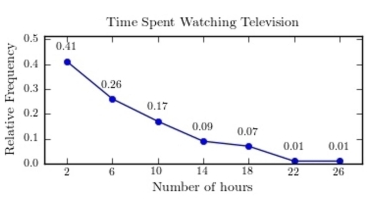
C) 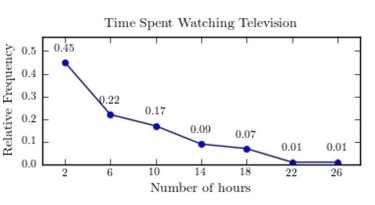
D) 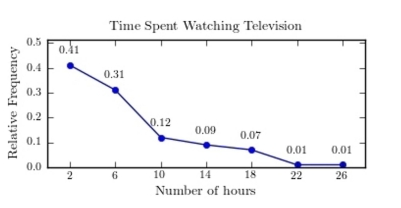
Correct Answer:

Verified
Correct Answer:
Verified
Related Questions
Q90: Following is a pie chart that
Q91: The following table presents the purchase
Q92: What is the upper class boundary of
Q93: The following frequency distribution presents the
Q94: A recent statistics exam yielded the
Q96: An automobile dealer wants to construct
Q97: The following frequency distribution presents the
Q98: <span class="ql-formula" data-value="\text { A pie graph
Q99: Which type of graph represents the data
Q100: Find the class boundaries, midpoint, and width