Multiple Choice
The following table presents the purchase totals (in dollars) of a random sample of gasolis purchases at a convenience store.
Construct a frequency histogram using a class width of 10 , and using 0 as the lower class the first class.
A) 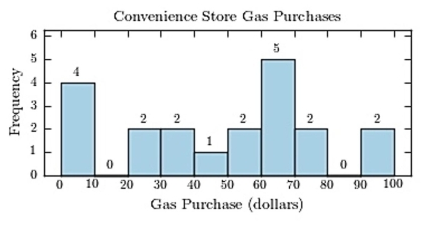
B) 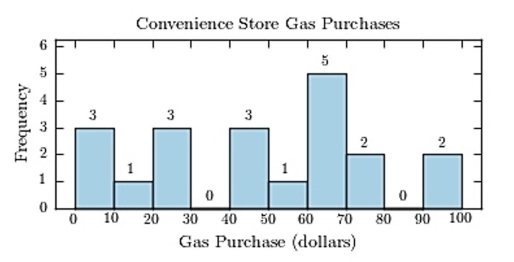
C) 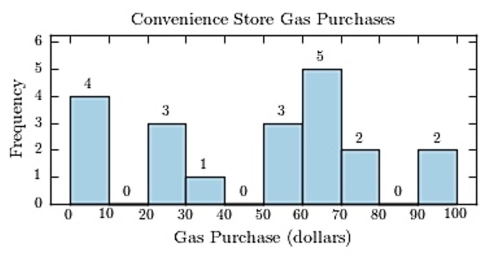
D) 
Correct Answer:

Verified
Correct Answer:
Verified
Related Questions
Q86: <span class="ql-formula" data-value="\text { Classify the histogram
Q87: The following pie chart presents the percentages
Q88: The following information shows the colors
Q89: A Pareto chart is useful for showing
Q90: Following is a pie chart that
Q92: What is the upper class boundary of
Q93: The following frequency distribution presents the
Q94: A recent statistics exam yielded the
Q95: A sample of 200 high school
Q96: An automobile dealer wants to construct