Multiple Choice
Find the indicated IQ score. The graph depicts IQ scores of adults, and those scores are normally distributed with a mean of 100 and a standard deviation of 15 (as on the Wechsler test) . 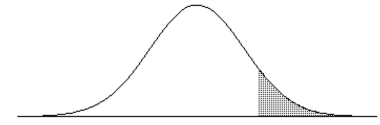 The shaded area under the curve is 0.10.
A) 108.1
B) 100.5
C) 80.8
D) 119.2
Correct Answer:

Verified
Correct Answer:
Verified
Q12: Samples of size n = 900 are
Q13: How does the standard normal distribution differ
Q14: Estimate the indicated probability by using the
Q15: Assume that adults have IQ scores that
Q16: Find the area of the shaded region.
Q18: Find the indicated z score. The graph
Q19: Estimate the indicated probability by using the
Q20: In a population of 210 women,
Q21: A population consists of these values:
Q22: The Precision Scientific Instrument Company manufactures thermometers