Multiple Choice
Find the indicated z score. The graph depicts the standard normal distribution with mean 0 and standard deviation 1.
-Shaded area is 0.0901. 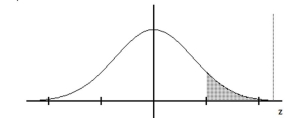
A) 1.34
B) 1.45
C) 1.39
D) 1.26
Correct Answer:

Verified
Correct Answer:
Verified
Related Questions
Q13: How does the standard normal distribution differ
Q14: Estimate the indicated probability by using the
Q15: Assume that adults have IQ scores that
Q16: Find the area of the shaded region.
Q17: Find the indicated IQ score. The graph
Q19: Estimate the indicated probability by using the
Q20: In a population of 210 women,
Q21: A population consists of these values:
Q22: The Precision Scientific Instrument Company manufactures thermometers
Q23: Using the following uniform density curve, answer