Essay
A parcel delivery service lowered its prices and finds that it has delivered twice as many parcels this year as it did last year. To illustrate this fact, the manager draws a graph as shown below. Each cube depicts a parcel. The side length of the "parcel" on the right is twice the side length of the "parcel" on the left. Why is this graph misleading? What visual impression is created by the graph? 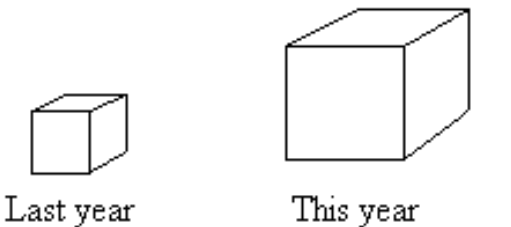
Correct Answer:

Verified
The volume of the cube on the right is e...View Answer
Unlock this answer now
Get Access to more Verified Answers free of charge
Correct Answer:
Verified
View Answer
Unlock this answer now
Get Access to more Verified Answers free of charge
Q32: The histogram below represents the number of
Q33: The graph below shows the average cost
Q35: The frequency distribution below summarizes employee
Q36: The following frequency distribution analyzes the
Q38: Construct a pie chart representing the
Q39: Use the given data to construct
Q40: The frequency distribution below summarizes the
Q41: In a survey, 26 voters were
Q42: The following data consists of the
Q45: Describe at least two advantages to using