Essay
The graph below shows the average cost of renting a studio in one city in each of the years 2002 through 2006. By what percentage does the average price increase from 2002 to 2003?
Obtain a second version of the graph by sliding a piece of paper over the bottom of the graph so that the bars start at 300. In this new graph, by what percentage does the price appear to increase from 2002 to 2003? Is the second graph misleading? 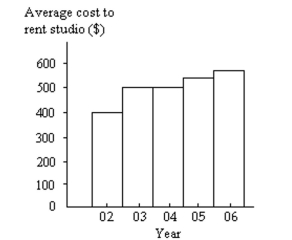
Correct Answer:

Verified
The average price increases by 25% from ...View Answer
Unlock this answer now
Get Access to more Verified Answers free of charge
Correct Answer:
Verified
View Answer
Unlock this answer now
Get Access to more Verified Answers free of charge
Q28: On a math test, the scores
Q29: Use the high closing values of
Q30: Consider the frequency distribution below, which
Q31: The midterm test scores for the
Q32: The histogram below represents the number of
Q35: The frequency distribution below summarizes employee
Q36: The following frequency distribution analyzes the
Q37: A parcel delivery service lowered its prices
Q38: Construct a pie chart representing the
Q45: Describe at least two advantages to using