Multiple Choice
Construct a pie chart representing the given data set.
-The following figures give the distribution of land (in acres) for a county containing 98,000 acres.

A) 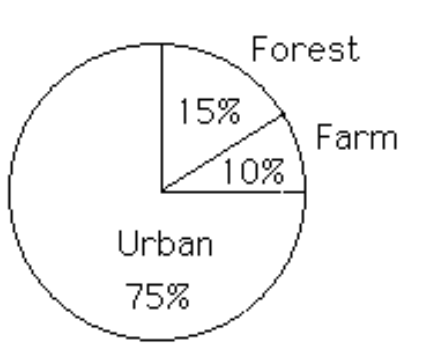
B) 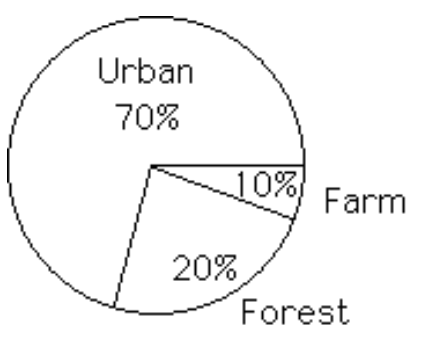
Correct Answer:

Verified
Correct Answer:
Verified
Related Questions
Q33: The graph below shows the average cost
Q35: The frequency distribution below summarizes employee
Q36: The following frequency distribution analyzes the
Q37: A parcel delivery service lowered its prices
Q39: Use the given data to construct
Q40: The frequency distribution below summarizes the
Q41: In a survey, 26 voters were
Q42: The following data consists of the
Q43: A nurse measured the blood pressure of
Q45: Describe at least two advantages to using